Monday, May 26, 2014

How to automate video screen grabs using ffmpeg

Part 1 of this 2-part series explains how to use VLC, a GUI-based video player, to capture single still frames from a video file. If you are taking many snapshots, you may find the manual VLC method too laborious. This post shows how to automate the capture process using ffmpeg, a command-line tool.

Extract frame at a given instant

The first scenario is to simply take a single snapshot at a given time instant.

$ ffmpeg -i P5080821.MP4 -vframes 1 -ss 00:01:39 $(date +%Y%m%d-%H%M%S).png

Notes:

  • -i

    P5080821.MP4 is the input video file.

  • -vframes

    The number of frames or snapshots to capture is 1.

  • -ss

    Skip ahead the input video for the given time interval from the start of the video. The time interval can be specified in the number of seconds, or in the "hh:mm:ss[.xxx]" format. The above example takes a snapshot at 1 minute 39 seconds from the start.

  • PNG file name

    The name of the output file contains the file creation timestamp formatted using the date command.

Auto extract multiple frames

Suppose you want to extract a series of frames taken at a regular time interval starting from a specific time instant. The following example extracts one frame per second starting at 1 minute 39 seconds into the video.

$ ffmpeg -i P5080821.MP4 -r 1 -ss 00:01:39 example-%03d.png

Notes:

  • -r

    This is the frame rate per second (e.g., 1 per second).

  • %03d

    The output files are sequentially numbered starting at 001. Output files from the above example will be named example-001.png, example-002.png, example-003.png, etc.

If the video is long, you may end up with too many pictures. You may limit the number of frames by specifying the absolute number of frames (-vframes) to extract or the absolute time duration (-t).

$ ffmpeg -i P5080823.MP4 -r 1 -ss 00:01:39 -t 00:02:00 example-%03d.png

In the above example, snapshots are taken at a rate of 1 frame per second, starting at 1 minute 39 seconds into the video, and only for a duration of 2 minutes.

Thursday, May 22, 2014

How to capture still frame images from a video clip

I own a point-and-shoot digital camera which also shoots movies. As a novice photographer, I struggle in taking indoor evening pictures. Finally, I resort to first making a movie with the camera, followed by capturing still frames from the movie file. This post is part 1 of a 2-part series to explain the latter.

In this post, we go over how to capture, using a GUI tool, a single frame from a movie file. Part 2 presents the ffmpeg command to automate the video snapshot of multiple still frames.

VLC and Totem are 2 GUI-based video players which can take video snapshots. The rest of this post focuses on VLC.

To extract a single still frame from a video file:

  1. Open VLC and play the video file.
  2. Optionally, click the Pause button to freeze the playback at the frame of which you want to take a snapshot.

    You don't have to pause the playback to capture the frame. However, by doing so, you know exactly what is being captured.

  3. Take a snapshot by pressing the Hotkey combination Shift-S.

    Alternatively, click the Take Snapshot option in the Video menu.

By default, the video snapshot is saved to a time-stamped PNG file in your Home Pictures directory, for instance, /home/peter/Pictures/vlcsnap-2014-05-19-19h42m22s243.png.

You can customize the name, the location, and the image format of the picture file.

To customize,

  1. Select the Preferences option in the Tools menu.
  2. Click Video to bring up the Video snapshots settings.
  3. Change the Video snapshots settings.
    • Directory

      Specify the directory for holding the output picture files.

    • Prefix

      Specify the prefix which is the first part of the output file name.

      $T is a special variable that you can insert into the prefix, e.g., "vlcsnap-$T-". To generate the file name, VLC replaces $T with the elapsed timestamp of when the snapshot was taken relative to the start of the video. For instance, the file name vlcsnap-00_05_37-2014-05-19-19h42m22s243.png indicates that the snapshot was taken at 0 hour 5 minutes 37 seconds into the video.

    • Sequential numbering

      By default, Sequential Numbering is disabled. VLC appends the file creation timestamp to the prefix. For instance, the file vlcsnap-00_05_37-2014-05-19-19h42m22s243.png was created at 7:42 pm on May 19, 2014.

      If Sequential Numbering is enabled, the creation timestamp is replaced by a sequential numbering scheme, starting at 1 (vlcsnap-00_05_37-00001.png).

    • Format

      Choose either PNG or JPG.

  4. Restart the VLC application.

Part 2 introduces the ffmpeg command to automate the video capture of multiple still frames.

Monday, May 19, 2014

Find the Fedora/Red Hat package providing a command

My previous post explains, given a Debian or Ubuntu system, how to find the package that provides a command or file. This post covers the same topic but for Fedora or any modern RPM-based system.

yum provides

Suppose you want to run the mate-system-log command.

$ mate-system-log -bash: mate-system-log: command not found

To identify the package that provides mate-system-log:

$ yum provides mate-system-log Loaded plugins: langpacks, refresh-packagekit mate-system-log-1.6.0-3.fc19.i686 : A log file viewer for the MATE desktop Repo : fedora mate-system-log-1.6.1-1.fc19.i686 : A log file viewer for the MATE desktop Repo : updates

The yum provides command searches the yum cache which contains information about the installed package base as well as what is available in the configured repositories. It matches the input argument against meta-data in the yum cache as a command/feature (mate-system-log), or as a file path. The latter enables you to find the package that provides a file:

$ yum provides /etc/wgetrc Loaded plugins: langpacks, refresh-packagekit wget-1.14-5.fc19.i686 : A utility for retrieving files using the HTTP or FTP protocols Repo : fedora Matched from: Filename : /etc/wgetrc wget-1.14-10.fc19.i686 : A utility for retrieving files using the HTTP or FTP protocols Repo : updates Matched from: Filename : /etc/wgetrc wget-1.14-10.fc19.i686 : A utility for retrieving files using the HTTP or FTP protocols Repo : @updates Matched from: Filename : /etc/wgetrc

yum search

Suppose you want to find the package that provides the Apache Web Server. Unless you know the exact package name, yum provides is not helpful in this case.

$ yum provides apache Loaded plugins: langpacks, refresh-packagekit No matches found

Instead, use yum search. It matches the input keywords against both the package name as well as the package description.

$ yum search Apache Web Server Loaded plugins: langpacks, refresh-packagekit ===== N/S matched: Apache, Web, Server ===== apache-commons-digester.noarch : XML to Java object mapping module apache-rat.noarch : Apache Release Audit Tool (RAT) httpd.i686 : Apache HTTP Server system-config-httpd.noarch : Apache configuration tool <snipped>

From the above output, we can conclude that the package providing Apache is httpd.

Wednesday, May 14, 2014

Identify the Debian/Ubuntu package containing a command/filename

Consider this scenario: you read about this excellent Linux command that is new to you. You quickly try it out, and discover that the command is not found. Before you can install the command, you must first find the name of the package that provides it.

Below, we outline the instructions to search for a package in Debian/Ubuntu. My next post will do the same for Fedora/Red Hat.

Debian offers multiple command-line tools to search for a package, and which one to use depends on how wide you want to search.

Do you want to search in the installed package base only, or in the entire release repository? Do you want to match the keywords against the file path only, or against the package description as well?

dpkg

Given a file path pattern, the dpkg -S command searches among installed packages only. The pattern is used to match the file path, but not the package description.

$ dpkg -S iostat sysstat: /usr/bin/nfsiostat sysstat: /usr/share/man/man1/iostat.1.gz sysstat: /usr/share/man/man1/nfsiostat.1.gz linux-headers-3.2.0-4-common: /usr/src/linux-headers-3.2.0-4-common/include/linux/nfs_iostat.h sysstat: /usr/bin/iostat sysstat: /usr/share/man/man1/cifsiostat.1.gz sysstat: /usr/bin/cifsiostat nfs-common: /usr/sbin/nfsiostatg nfs-common: /usr/share/man/man8/nfsiostat.8.gz

Note that the above search returns more results than we want. This is because the query automatically adds the wildcard character "*" before and after your search keyword iostat. Hence it matches /usr/bin/nfsiostat as well as /usr/share/man/man1/iostat.1.gz.

If you are sure about the command name, enter it with the following wildcard pattern to avoid the extra output:

$ dpkg -S */iostat$* sysstat: /usr/bin/iostat

The above output concludes that the sysstat package contains the iostat command.

If the result is path not found matching pattern, it simply means that the command is not in the installed package base. Use apt-file or apt-cache to expand your search.

apt-file

To install apt-file:

$ sudo apt-get update $ sudo apt-get install apt-file

apt-file builds its own database to index files provided by packages. Before your first search - and periodically after that - you must update the database as follows:

$ apt-file update Downloading complete file http://deb.vanvps.com/debian/dists/wheezy/main/Contents-amd64.gz % Total % Received % Xferd Average Speed Time Time Time Current Dload Upload Total Spent Left Speed 100 20.4M 100 20.4M 0 0 372k 0 0:00:56 0:00:56 --:--:-- 373k Ignoring source without Contents File: http://security.debian.org/dists/wheezy/updates/main/Contents-amd64.gz Downloading Index http://deb.vanvps.com/debian/dists/wheezy-updates/main/Contents-amd64.diff/Index: % Total % Received % Xferd Average Speed Time Time Time Current Dload Upload Total Spent Left Speed 0 1057 0 0 0 0 0 0 --:--:-- --:--:-- --:--:-- 0 Index is up-to-date.

The apt-file update command reads the /etc/apt/sources.list file to identify the repositories used by your system, and the corresponding mirror sites for downloading packages. For instance, the following line is in sources.list:

deb http://deb.vanvps.com/debian/ wheezy main 

Then, it downloads, from the chosen mirror site, the architecture-specific (amd64) Contents file (http://deb.vanvps.com/debian/dists/wheezy/main/Contents-amd64.gz). The Contents file lists all files in all packages of the selected release (wheezy) and archive area (main).

Now that the database is up-to-date, you are ready to do the actual search:

$ apt-file search -x /pdfcrop$ texlive-extra-utils: /usr/bin/pdfcrop

With the -x parameter, the search string is treated as a regular expression. Therefore, the "$" character is interpreted as "end of line" instead of literally as the dollar sign.

apt-cache

$ sudo apt-get update $ apt-cache search 2ping 2ping - Ping utility to determine directional packet loss texlive-extra-utils - TeX Live: TeX auxiliary programs

The apt-cache search command searches the apt cache database for the given pattern (2ping). Before the search, update the apt cache database with apt-get update. The update command reads the /etc/apt/sources.list file, and updates package information for the repositories specified in the file.

By default, apt-cache matches the input pattern (2ping) against both package names and package descriptions stored in the apt cache. Note that the above search returns the texlive-extra-utils package because a match is found in the package description. To view the package description, run the apt-cache show command:

$ apt-cache show texlive-extra-utils

If the --names-only parameter is specified to apt-cache search, only the package name is matched (and the description is not).

$ apt-cache search --names-only 2ping 2ping - Ping utility to determine directional packet loss

The next article discusses how you accomplish the same task in Fedora, and any RPM-based distribution.

Friday, May 9, 2014

Plot bar charts using gnuplot (part 3/3)

Parts one and two of this series illustrate how to use gnuplot to plot a two-dimensional point graph with time-series data. This post, the third and final of the series, focuses on plotting a bar chart.

The raw input data consists of the daily number of page views, and clicks for this blog from 2005 to 2014:

Date Page views Clicks 2005-08-01 9 0 2005-08-02 65 1 <snipped> 2014-04-29 2862 10 2014-04-30 2256 2

My objective is to visualize if the day of the week determines the amount of web traffic to this blog.

gnuplot is used to generate the following bar chart with a date range from January 1, 2014 to April 1, 2014.

The number of page views is plotted for each day in the date range. A unique color is used depending on the day of the week. Using the color cues from the above bar chart, we can conclude that Saturdays and Sundays generally underperform as compared to the rest of the week.

The script for plotting the bar chart is listed below and it is also linked at https://bit.ly/1oeDsq1.

# Plot style set style data boxes set style fill solid set boxwidth 0.5 # Term type, background color, canvas size set terminal png background "#330000" \ size 1920, 960 \ font "/usr/share/fonts/truetype/msttcorefonts/Arial.ttf,18" # Output file name set output "dayOfWeek.png" # Input data configuration # set datafile separator "," # set datafile missing "?" # Independent variable (X) = Time series set xdata time set timefmt "%Y-%m-%d" set format x "%a %m-%d" # Specify subset date range xstart="2014-01-01" xend ="2014-04-01" set xrange [xstart:xend] # Define custom display styles set style line 1 lt 1 lc rgb "#FF9900" set style line 2 lt 2 lc rgb "#00FFFF" set style line 3 lt 3 lc rgb "#FFCC66" set style line 4 lt 4 lc rgb "#FF0000" set style line 5 lt 5 lc rgb "#FF00FF" set style line 6 lt 6 lc rgb "#0000FF" set style line 7 lt 7 lc rgb "#CC3300" set style line 8 lc rgb "#FFFFFF" # Axis tic marks set xtics tc ls 8 rotate set xtics xstart, 172800, xend set ytics tc ls 8 set bmargin 8 set tics nomirror # Axis labels set xlabel "Date" tc ls 8 offset -35, -3 set ylabel "Page Views" tc ls 8 # Key (Legend) set key font "/usr/share/fonts/truetype/msttcorefonts/Arial.ttf,16" set key tc ls 8 set key outside bottom horizontal # Misc. set title "Week of Day Stats" tc ls 8 set grid set border lw 1 ls 8 # Plot plot "report.dat" every 7::2711 using 1:2 \ title "Wed" ls 1, \ '' every 7::2712 using 1:2 \ title "Thu" ls 2, \ '' every 7::2713 using 1:2 \ title "Fri" ls 3, \ '' every 7::2714 using 1:2 \ title "Sat" ls 4, \ '' every 7::2715 using 1:2 \ title "Sun" ls 5, \ '' every 7::2716 using 1:2 \ title "Mon" ls 6, \ '' every 7::2717 using 1:2 \ title "Tue" ls 7

Below, I highlight the key differences between the above bar chart script and the points graph script in part 1. Please refer to the explanation in part 1 for the common elements. The official gnuplot user manual is also a good resource.

Plot style

set style data boxes set style fill solid set boxwidth 0.5
  • The plot style is boxes.
  • The boxes are filled with solid colors.
  • The box width is set to a small value in order to plot 3 months worth of data.

Time-series variable

set format x "%a %m-%d"
The tic mark labels on the "x" axis now include the day of the week (%a).

Custom line styles

set style line 1 lt 1 lc rgb "#FF9900" set style line 2 lt 2 lc rgb "#00FFFF" set style line 3 lt 3 lc rgb "#FFCC66" set style line 4 lt 4 lc rgb "#FF0000" set style line 5 lt 5 lc rgb "#FF00FF" set style line 6 lt 6 lc rgb "#0000FF" set style line 7 lt 7 lc rgb "#CC3300" set style line 8 lc rgb "#FFFFFF"
  • Seven custom line styles - indexed 1 to 7 - are defined, one per each day of the week.
  • Line style 8 is created for labels, grid lines, and borders.

X axis tics

set xtics xstart, 172800, xend

The triplet xstart, 172800, xend specifies the scale of the "x" axis. Specifically, the "x" axis labels range from 2014-01-01 (xstart) to 2014-04-01 (xend) incrementing every 2 days (or 172800 seconds).

Key (Legend)

set key outside bottom horizontal

The legend is moved to the bottom and outside of the plot area. In addition, instead of stacking the keys vertically, they are laid out horizontally.

Plot

plot "report.dat" every 7::2711 using 1:2 \ title "Wed" ls 1, \ '' every 7::2712 using 1:2 \ title "Thu" ls 2, \ '' every 7::2713 using 1:2 \ title "Fri" ls 3, \ '' every 7::2714 using 1:2 \ title "Sat" ls 4, \ '' every 7::2715 using 1:2 \ title "Sun" ls 5, \ '' every 7::2716 using 1:2 \ title "Mon" ls 6, \ '' every 7::2717 using 1:2 \ title "Tue" ls 7
  • 7 plots are defined, each assigned to a unique line style (ls).
  • All 7 plots draw from the same input data file report.dat.
  • To specify how input data is distributed to the 7 plots, you need to look up the first day of your target date range (January 1, 2014) in the input data file. It happens to be line 2712. As a result, all 7 plots skip the first 2711 lines in the input file.
  • The first plot starts at line 2712 of the input file, and skips ahead every 7 days(every 7::2711). Note that, because line numbers are 0-based, it is specified as 2711 in the every clause.
  • January 1 is a Wednesday which is explicitly specified as the title of the first plot.
  • Each subsequent plot starts at one line below its predecessor. Therefore, plot 2 starts at line 2713 (but specified as 2712 in every 7::2712).

Monday, May 5, 2014

gnuplot explained (part 2/3)

Part 1 of this series presented a gnuplot script to plot the following two-dimensional graph. This post continues the discussion of the commands in the script.

Time series variable

set xdata time set timefmt "%Y-%m-%d" set format x "%Y/%m/%d"
  • The first command - set xdata time - explicitly tells gnuplot that the "x" variable contains timestamps.
  • The second command specifies how those timestamps are formatted in the input data file. For a list of timestamp component codes, please refer to the Time/date specifiers section (page 114) in the official gnuplot manual.
  • The third command - set format x - specifies the format of tic labels on the "x" axis.

Narrow date range

xstart="2008-01-01" xend ="2014-06-01" set xrange [xstart:xend]
  • The raw input data file contains data from 2005 to 2014, a span of about 9 years. You can plot a subset of the data by specifying a narrower date range.
  • The above example defines two user variables - xstart and xend - to delimit the "x" date range for the plot. Later, we reuse the variables to specify the date range for the tic marks on the "x" axis.

Custom line styles

set style line 1 lt 1 lc rgb "#FFCC66" set style line 2 lt 2 lc rgb "#FF00FF" pt 6 set style line 3 lc rgb "#FFFFFF"
  • The lines and point symbols in a plot have default properties such as color, and shape. The above commands define custom styles which can be assigned to a plot component to override the default property values.
  • Line styles 1, 2, and 3 are created.
  • As defined, line styles 1 and 2 are based on the default line types (lt) of the same number. A new line color(lc) is specified for the two line styles.
  • For line style 2, the point type (pt) is also changed. The point type defines the shape of the point symbol: type 6 is a small circle.

To view the default line type properties, executing the following gnuplot commands, and examine the output png:

set terminal png set output 'test.png' test set output

Axis tic marks

set xtics textcolor linestyle 3 rotate set ytics textcolor linestyle 1 set y2tics textcolor linestyle 2 set xtics xstart, 7776000, xend set bmargin 8 set tics nomirror
  • The tic marks on the "x" axis (xtics) adopt the text color of line style 3 defined earlier. Similarly, the tic marks for the "y" and "y2" axes adopt the text color of line styles 1 and 2, respectively. Note that "y2" is the vertical axis on the right hand side.

    The color change is necessary because the default color for tic marks assumes a white background. Given that the background was modified to a dark color, the tic marks blend into the background, making them invisible without the change.

  • By default, all axes are auto-scaled. The script specifies explicitly the scale for the "x" axis in the form of a triplet: xstart, 7776000, xend. The two user-defined variables, xstart and xend, contain the min and the max tic mark values on the "x" axis, respectively. The middle number is the increment in seconds (7776000 seconds equal 90 days).
  • Normally, the labels on the "x" axis are written horizontally. Using the horizontal orientation results in labels overlapping each other. To solve this problem, the script rotates the "x" axis labels by 90 degrees, hence rendering them vertically.

    A side effect is that the bottom margin (bmargin) needs to be increased to compensate for the longer "x" axis labels.

  • By default, all tic marks are mirrored on the opposite border (left "y" axis to right and vice versa, and bottom "x" axis to top and vice versa). The set tics nomirror command configures tic marks to not mirror.

Axis labels

set xlabel "Date" tc ls 3 offset 0,-3 set ylabel "Count" tc ls 3 set y2label "Count" tc ls 3
  • The axis labels are assigned the text color(tc) of line style (ls) 3. Note that you can abbreviate the names of common gnuplot objects: ls for linestyle.
  • The color change is necessary to make the labels visible in a dark background.
  • The "x" label is relocated downward by the offset to compensate for the vertical labels.

Key/Legend

set key title "Legend" set key font "/usr/share/fonts/truetype/msttcorefonts/Arial.ttf,16" set key textcolor ls 3 set key box ls 3 lw 2 height 2 spacing 3 set key top left set key Left
  • The set key box command specifies that the legend is to be enclosed in a box.

    The box is assigned line style 3. The line width(lw), the height, and the spacing are customized to make it look pretty.

  • By default, the legend is placed at the top right corner inside the plot. The set key top left command relocates the legend to the top left.
  • The Left keyword (with the capital L) left justifies the text in the legend body.

Miscellaneous

set title "Web Site Stats" textcolor ls 3 set grid set border linewidth 1 linestyle 3
  • A title for the plot is specified, and assigned the text color of line style 3.
  • Grid lines are enabled.
  • Borders are enabled, and assigned a line width and style.

Plot

plot "report.dat" every ::1 using 1:2 \ title "#PageViews" axes x1y1 ls 1, \ '' every ::1 using 1:3 \ title "#Clicks" axes x1y2 ls 2

With the set-up complete, we are ready to issue the plot command.

  • Two plots are defined, separated by a comma on the command line.
  • Both plots are taken from the same input data file: report.dat.

    As a shorthand, enter two quotes for the second plot instead of repeating the filename.

  • every ::1 skips the first line in the input file which is the heading line. Instead, we specify explicitly the titles on the plot command line.
  • The source of the variables "x" and "y" are specified by the two numbers in using x:y. The variable "x" in both plots is taken from the first field in the input file (the "1" in 1:2 and 1:3). The variable "y" is taken from field 2, and field 3 respectively.
  • The 2 plots share the same x1 axis (the bottom axis). The number of page views are placed on the y1 (left) axis while the clicks are placed on the y2 (right) axis.
  • The 2 plots are assigned the line styles (ls) 1 and 2 respectively.

Part 3 of the series illustrates how to plot a bar chart using gnuplot.

Friday, May 2, 2014

How to plot 2D data using gnuplot

As the publisher of this web site, I am interested in visualizing readership growth over time. With that in mind, I set out to plot the number of page views and clicks over time.

Linux is well stocked with data plotting software. This 3-part series introduces gnuplot, a command-line tool, to plot two-dimensional time-series data. Parts 1 and 2 explain how to plot a points graph; part 3, a bar chart.

Available to me is an input file containing, among other things, the number of page views and ads clicks from 2005 to 2014.

Date Page views Clicks 2005-08-01 9 0 2005-08-02 65 1 2005-08-03 20 0 <snipped> 2014-04-28 2811 8 2014-04-29 2862 10 2014-04-30 2256 2

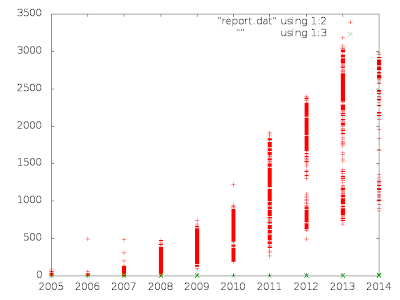
To graph both page views and clicks against time, the minimal gnuplot command sequence is as follows:

set terminal png set output "webstats.png" plot "report.dat" using 1:2, \ "report.dat" using 1:3

The first 2 commands specify respectively the output type (png format), and the output filename (webstats.png).

The third command specifies two plots with the same raw input data file(report.dat). The independent variable ("x") in both plots is the first field in the input file (the "1" in 1:2 and 1:3). The dependent variable ("y") is field 2 and field 3 respectively.

You can enter each command interactively in gnuplot. Or put all the commands in a script, say mystats.gp, and pipe the file to gnuplot.

$ cat mystats.gp |gnuplot

The output graph plotted by the above commands is rather unreadable. The rest of this post explains how to turn that into this:

Below is the complete script to generate the nice looking graph. Please consult the official user manual for details.

# Plot style set style data points # Term type & background color, canvas size set terminal png background "#330000" size 1920, 960 \ font "/usr/share/fonts/truetype/msttcorefonts/Arial.ttf,18" # Output file name set output "webstats.png" # Input data configuration # set datafile separator "," # set datafile missing "?" # Independent variable (X) = Time series set xdata time set timefmt "%Y-%m-%d" set format x "%Y/%m/%d" # Specify subset date range xstart="2008-01-01" xend ="2014-06-01" set xrange [xstart:xend] # Define custom display styles set style line 1 lt 1 lc rgb "#FFCC66" set style line 2 lt 2 lc rgb "#FF00FF" pt 6 set style line 3 lc rgb "#FFFFFF" # Axis tic marks set xtics textcolor linestyle 3 rotate set xtics xstart, 7776000, xend set bmargin 8 set ytics textcolor linestyle 1 set y2tics textcolor linestyle 2 set tics nomirror # Axis labels set xlabel "Date" tc ls 3 offset 0,-3 set ylabel "Count" tc ls 3 set y2label "Count" tc ls 3 # Key (Legend) set key font "/usr/share/fonts/truetype/msttcorefonts/Arial.ttf,16" set key tc ls 3 set key top left set key box ls 3 lw 2 height 2 spacing 3 set key title "Legend" set key Left # Misc. set title "Web Site Stats" tc ls 3 set grid set border linewidth 1 linestyle 3 # Plot: Skip line 1 (heading) plot "report.dat" every ::1 using 1:2 \ title "#PageViews" axes x1y1 ls 1, \ '' every ::1 using 1:3 \ title "#Clicks" axes x1y2 ls 2

Plotting style

set style data [points| linespoints| lines]

Specify the default plot style.

The points style draws a small disjoint symbol for each "y" data value.

If you prefer adjacent symbols to be connected by a line, use the linespoints style.

Want lines to connect the adjacent data values but no symbols? That is the lines style.

Terminal type

set term png background "#330000" size 1920, 960 \ font "/usr/share/fonts/truetype/msttcorefonts/Arial.ttf,18"

The set terminal command specifies the terminal type, the background color, the canvas size, and the default text font.

  • Terminal type is a peculiar name to mean the output format. Besides png, other notable types are pdf, jpeg, and latex.
  • The default background color is white. If you want a dark background, specify the color in the #RRGGBB format, for instance, #330000. On-line tools are available to help you identify the color code.
  • The default canvas size is 640 x 480 pixels. The canvas is enlarged to hold all the required information.
  • The default font (Arial) and font size (18) are specified.

Output filename

set output "webstats.png"

Specify the output file within quotes.

Input data configuration

set datafile separator "," set datafile missing "?"
  • By default, gnuplot assumes the fields in the input data are separated by whitespaces (one or more spaces or tabs). If your input file is comma-separated, configure the separator parameter.
  • If your input file has missing data, set the missing parameter to a special string that denotes a field does not have a value, for instance, "?". Make sure that the empty fields in the input data file are populated with the "?" string.

Part 2 of this series explains the rest of the commands in the gnuplot script. Part 3 shows how to plot bar charts using gnuplot.